Toolpack:Configuring Call Trace B
Candy Chan (Talk | contribs) m (Typo) |
(→List of Parameters) |
||
| (6 intermediate revisions by one user not shown) | |||
| Line 12: | Line 12: | ||
* The termination result code, and more. | * The termination result code, and more. | ||
| − | A call path is shown as separate call legs, distinguishing the incoming portion with other portions of a call. | + | A call path is shown as separate call legs, distinguishing the incoming portion with other portions of a call. Calls may be filtered by called number, calling number, Network Access Point (NAP), time of day range, protocol and direction. |
| − | + | ||
| − | Calls may be filtered by called number, calling number, Network Access Point (NAP), time of day range, protocol and direction. | + | |
<div class="mw-collapsible mw-collapsed" data-collapsetext="Enabling Call Trace" data-expandtext="Enabling Call Trace" style="width: 400px;"> | <div class="mw-collapsible mw-collapsed" data-collapsetext="Enabling Call Trace" data-expandtext="Enabling Call Trace" style="width: 400px;"> | ||
| Line 20: | Line 18: | ||
'''This procedure only needs to be carried out one time for each system.''' | '''This procedure only needs to be carried out one time for each system.''' | ||
| − | 1- Select ''' | + | 1- Select '''Applications''' in the navigation menu. |
| − | [[Image: | + | [[Image:ConfigureCallTrace_9_A.png|200px]] |
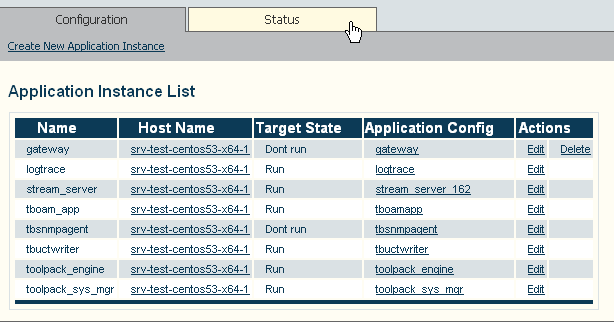
2- Select the '''Status''' tab. | 2- Select the '''Status''' tab. | ||
| Line 35: | Line 33: | ||
</div> | </div> | ||
| + | Call trace enables a default of 10,000 call legs to be stored in the system and to be viewed using the Web Portal. This value can be increased from the Call Trace application configuration parameters. | ||
| − | + | 1- Select '''Applications''' in the navigation menu. | |
| − | + | ||
| − | 1- | + | |
| − | + | ||
| − | + | ||
| − | + | ||
| − | + | ||
| − | + | ||
| − | + | ||
| − | + | ||
| − | + | ||
| − | + | ||
| − | + | ||
| − | + | ||
| − | + | ||
| − | + | ||
| − | + | ||
| − | + | ||
| − | + | ||
| − | + | ||
| − | + | ||
| − | + | ||
| − | + | ||
| − | + | ||
| − | + | ||
| − | + | ||
| − | + | ||
| − | + | ||
| − | + | ||
| − | + | ||
| − | + | ||
| − | + | ||
| − | + | ||
| − | + | ||
| − | + | ||
| − | + | ||
| − | + | ||
| − | + | ||
| − | + | ||
| − | + | ||
| − | + | ||
| − | + | ||
| − | + | ||
| − | + | ||
| − | + | ||
| − | + | ||
| − | + | ||
| − | + | [[Image:ConfigureCallTrace_9_A.png|200px]] | |
| − | + | ||
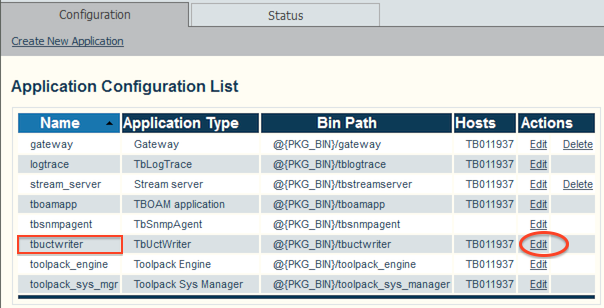
| − | + | 2- Select '''Edit'''. | |
| + | [[Image:ConfigureCallTrace_10_A.png]] | ||
| − | + | [[Image:ConfigureCallTrace_11_A.png]] | |
| − | + | ==List of Parameters== | |
| − | + | ||
| − | + | * [[Parameter: Call_Trace_Trace_Level|Trace Level]] | |
| + | * [[Parameter: Call_Trace_Maximum_Compressed_Directory_Size|Maximum compressed directory size]] | ||
| + | * [[Parameter: Maximum_File_Size|Maximum file size]] | ||
| + | * [[Parameter: Maximum_Call_Legs|Maximum call legs]] | ||
| + | * [[Parameter: Consulted_Legs_Recall|Consulted legs recall]] | ||
Latest revision as of 05:00, 25 March 2014
Applies to version v2.7
Call Trace is a diagnostic tool that is designed to trace the path a call takes through a Tmedia system, and to provide information about numerous aspects of the call path, such as:
- The routing decision
- The outgoing call
- Subsequent outgoing calls, in the case of a route retry
- Parameters selected for a SIP SDP
- The SIP Call-id
- The trunk and timeslot chosen for TDM protocols
- The termination result code, and more.
A call path is shown as separate call legs, distinguishing the incoming portion with other portions of a call. Calls may be filtered by called number, calling number, Network Access Point (NAP), time of day range, protocol and direction.
This procedure only needs to be carried out one time for each system.
1- Select Applications in the navigation menu.
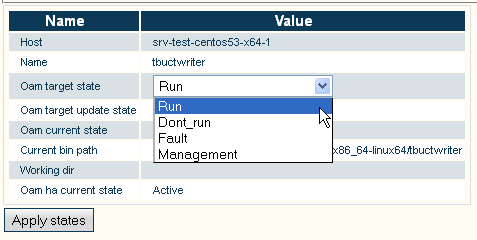
3- Select Run
- Click Apply States
Call trace enables a default of 10,000 call legs to be stored in the system and to be viewed using the Web Portal. This value can be increased from the Call Trace application configuration parameters.
1- Select Applications in the navigation menu.


