Toolpack:Status Menus:Hosts A
(→3- Filesystem Usage Tab) |
|||
| Line 67: | Line 67: | ||
[[Image:Toolpack_v2.5_Hosts_Filesystem_Usage.png]] | [[Image:Toolpack_v2.5_Hosts_Filesystem_Usage.png]] | ||
| + | |||
| + | |||
| + | ===5- Network Interfaces Tab=== | ||
| + | |||
| + | Under the '''Network Interfaces''' tab, a table of the network interfaces offered by the host is displayed. | ||
| + | This table describes the following values for each interface: | ||
| + | |||
| + | * Total number of bytes received | ||
| + | * Total number of error bytes received | ||
| + | * Number of bytes received per second | ||
| + | * Total number of bytes sent | ||
| + | * Total number of error bytes sent | ||
| + | * Number of bytes sent per second | ||
| + | |||
| + | |||
| + | [[Image:Toolpack_v2.5_Hosts_Network_Interfaces.png]] | ||
Revision as of 18:26, 6 February 2011
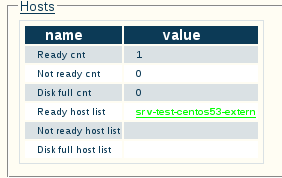
General status information about the host machine running system applications is accessible from the Host tab of the Global Status view.
The Host general view, shown below, lists the one or more hosts that are being used to run the applications of a Tmedia or Tdev system. In addition, this view indicates if the host is in a ready state.
Contents |
Detailed View
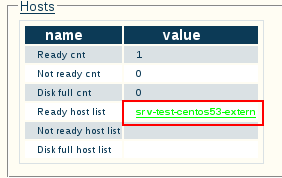
To view expanded information concerning the host operating system, click any host listed in the Ready host list:
In this view you can set the host's refresh frequency, as well as view various system details, by clicking the relevant tabs:
1- Host Tab
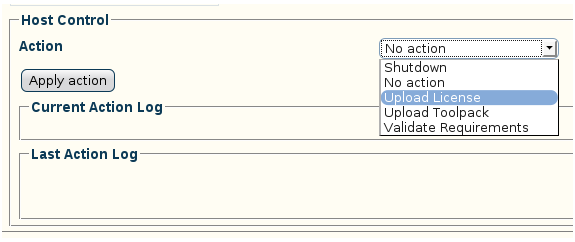
In the Host tab, under Host Control, a number of actions can be executed. These actions are:
- Shutdown
- Upload License
- Upload Toolpack
- Validate Requirements
2- Processor Usage Tab
Under the Processor Usage tab you may verify the percentage of processor usage your host currently occupies:
3- Memory Usage Tab
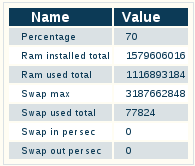
Under the Memory Usage tab you may verify the following values:
- Percentage of memory in use by the current host
- Size of total RAM installed
- Size of total RAM used
- Size of memory swap space in use
- Number of memory swaps in (per second)
- Number of memory swaps out (per second)
4- Filesystem Usage Tab
Under the Filesystem Usage tab you may verify the following values:
- Total disk space
- Total disk space available (free)
- Whether or not the disk is full, or can still be written to
5- Network Interfaces Tab
Under the Network Interfaces tab, a table of the network interfaces offered by the host is displayed. This table describes the following values for each interface:
- Total number of bytes received
- Total number of error bytes received
- Number of bytes received per second
- Total number of bytes sent
- Total number of error bytes sent
- Number of bytes sent per second


