Configuring Call Trace
| This article applies to: | Product | Version |
| Tmedia | 2.9, 2.10, 3.0, 3.2 | |
| SBC | 3.0, 3.1 |
Call Trace is a diagnostic tool that is designed to trace the path a call takes through a system, and to provide information about numerous aspects of the call path, such as:
- The routing decision
- The outgoing call
- Subsequent outgoing calls, in the case of a route retry
- Parameters selected for a SIP SDP
- The SIP Call-id
- The trunk and timeslot chosen for TDM protocols
- The termination result code, and more.
A call path is shown as separate call legs, distinguishing the incoming portion with other portions of a call. Calls may be filtered by called number, calling number, Network Access Point (NAP), time of day range, protocol and direction.
This procedure only needs to be carried out one time for each system.
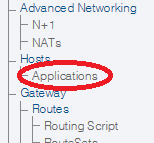
1- Select Applications in the navigation menu.
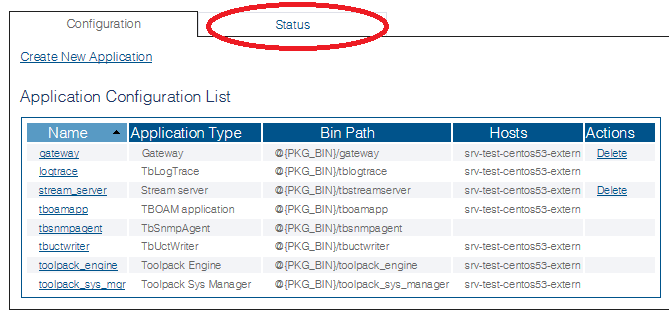
2- Select the Status tab.
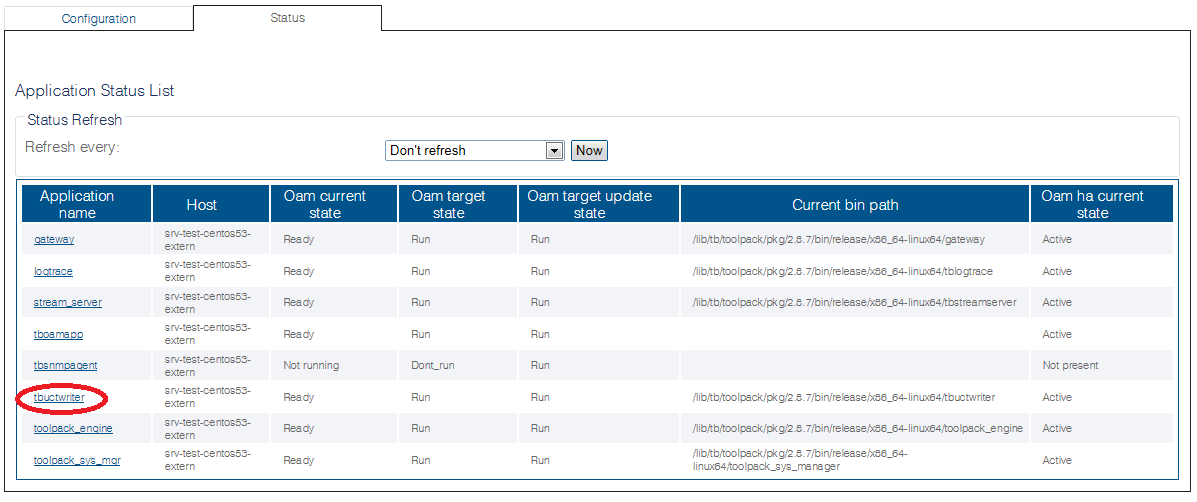
3- Select the tbuctwriter application
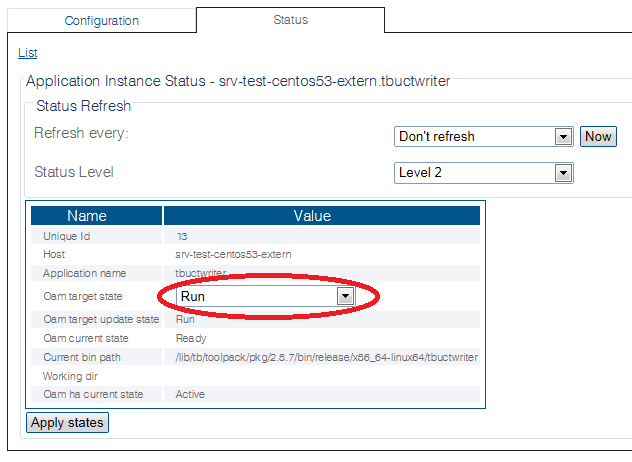
3- Select Run
- Click Apply States
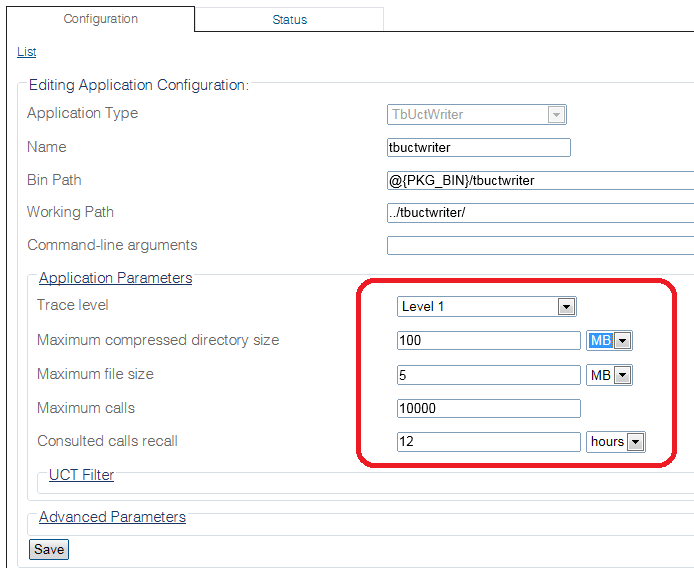
Call trace enables a default of 10,000 call legs to be stored in the system and to be viewed using the Web Portal. This value can be increased from the Call Trace application configuration parameters.
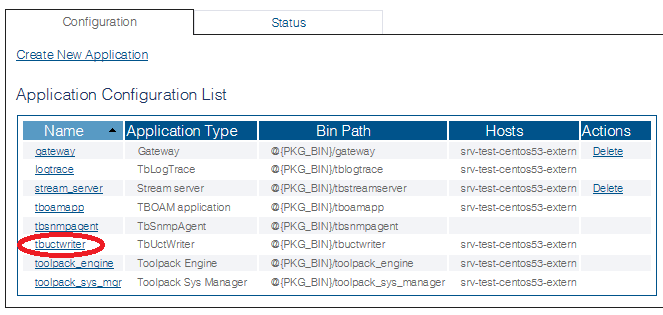
1- Select Applications in the navigation menu.
2- Select the tbuctwriter application
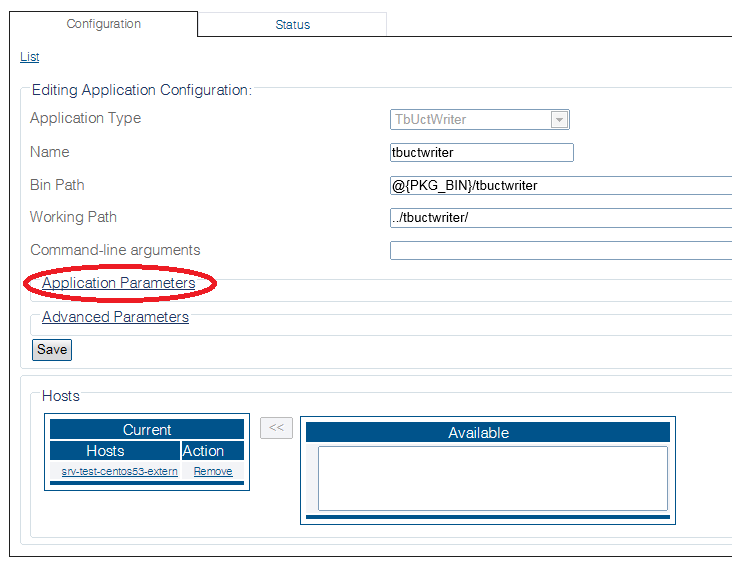
3- Click Application Parameters
4- Configure the Trace Level and other associated trace parameters.
- Click Save
Path
/configurations/AllynWikiSystem/applications/tbuctwriter/log_parameters
Parameters (text)
/configurations/aaa_Innsys_201602/applications/tbuctwriter/log_parameters
default_trace_level        = "Level 4 (quiet)"
log_file_path              = ""
max_gzipped_log_files_size = "100 MB"
max_log_file_segment_size  = "10 MB"
Parameters (json)
{
  "application_type" : "TbUctWriter",
  "bin_path" : "@{PKG_BIN}/tbuctwriter",
  "command_line_arguments" : "",
  "log_parameters" : {
    "default_trace_level" : "Level 4 (quiet)",
    "log_file_path" : "",
    "max_gzipped_log_files_size" : "100 MB",
    "max_log_file_segment_size" : "10 MB"
  },
  "working_path" : "../tbuctwriter/"
}
