Generating Graphs
From TBwiki
Applies to version v2.7
Global polling statistics setting can be displayed as graphs.
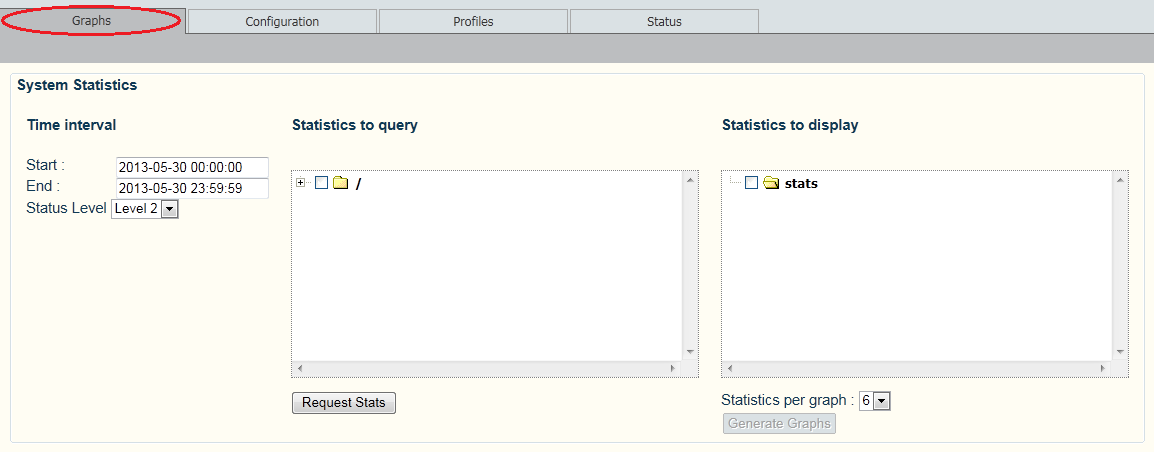
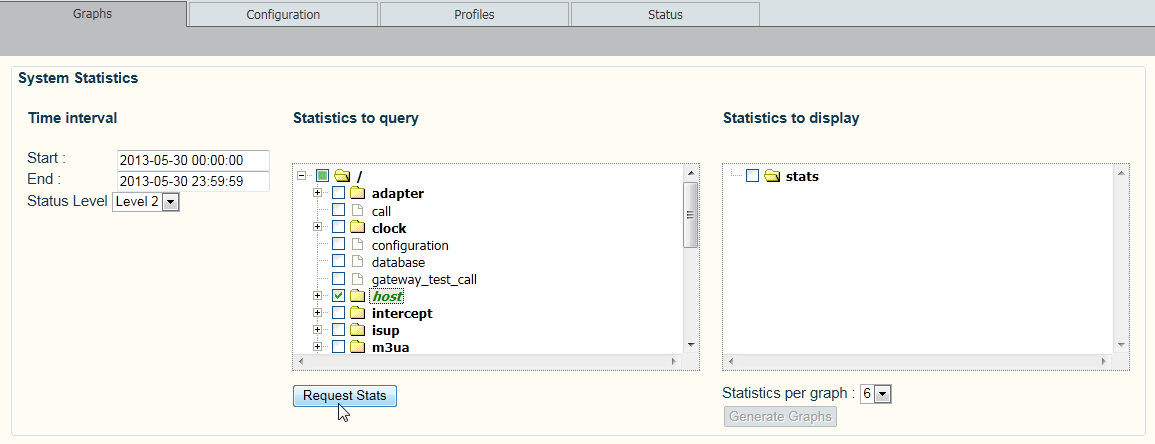
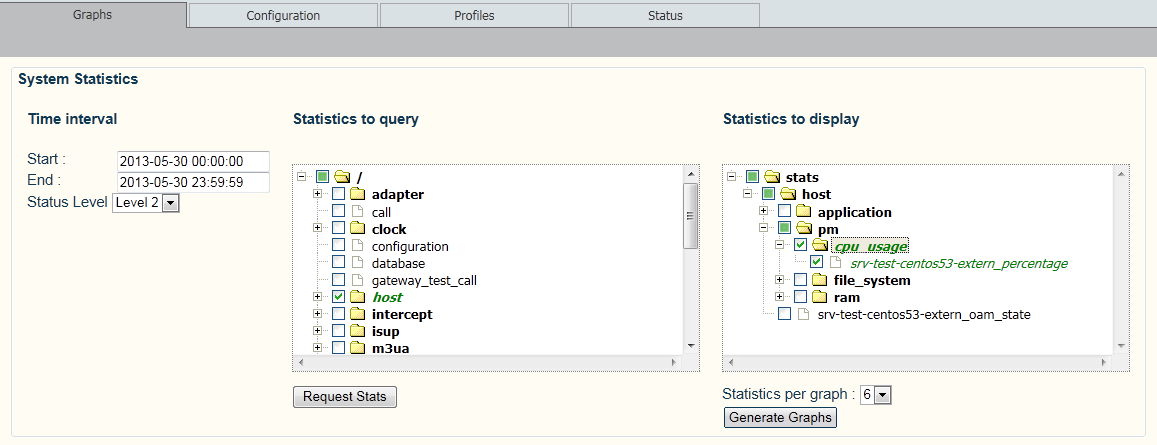
To display polled system statistics:
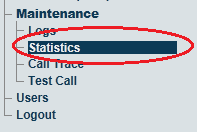
1- Click Statistics in the navigation panel
2- Configure Profiles settings:
- Select the Profiles tab.
- Click Create a new profile.
2- Enter a name for the profile.
- Click Save.
3- Click Create new paths
4- Select the paths to add to the profile
- Set the interval.
- Set the polling level.
- Select one or more paths.
- Click Add Selected.


