ProSBC Processor Usage
Contents |
This procedure is used to check the Processor usage of the ProSBC.
How to check processor usage from the web portal
From the web interface you can see the processor usage:
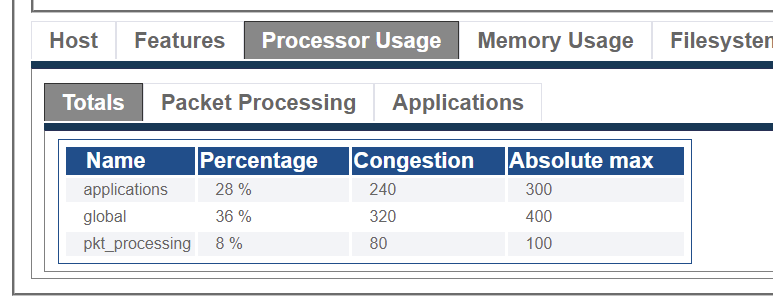
Hosts -> Status -> Select Host -> Processor Usage tab
Totals view show the global processor usage, and processor usage divided between applications and SBC processing

Packet Processing shows processor usage of each IP interfaces

Applications shows the processor usage of the individual applications and their theoretical maximums

Processor usage from SNMP
You can retrieve the processor usage from SNMP GET, using the TB-MIB TelcoBridges enterprise MIB.
The value is located in the tbSwPerfTable (OID: 1.3.6.1.4.1.21776.1.2.2.3)
Periodic logs on processor usage
Processor and memory usage are logged on the system. You can get access to these logs in this folder:
/lib/tb/toolpack/setup/12358/3.1/apps/tboamapp/log
It is also available in the TBReport
Accessing from the console
From the SSH access, here are the available commands.
With the top command you can see the total CPU usage (and Memory usage) of the host:
[root@prosbc-vm-a1]# top
top - 07:27:40 up 13 days, 17:50,  1 user,  load average: 1.29, 1.38, 1.54
Tasks: 140 total,   1 running, 139 sleeping,   0 stopped,   0 zombie
%Cpu(s): 26.0 us,  3.6 sy,  0.0 ni, 70.2 id,  0.0 wa,  0.0 hi,  0.2 si,  0.0 st
KiB Mem :  8042848 total,  1864328 free,  3560852 used,  2617668 buff/cache
KiB Swap:  2097148 total,  2097148 free,        0 used.  4157628 avail Mem

PID USER      PR  NI    VIRT    RES    SHR S  %CPU %MEM     TIME+ COMMAND
 708 root      20   0   65.1g 240676  17260 S 101.3  3.0  20052:50 tbrouter
 863 root      20   0       0      0      0 S   8.0  0.0   1636:13 kni_single
8276 root      20   0 2046568 146152   5808 S   1.7  1.8 214:46.81 tbsip
3495 root      20   0 1996260 127884   5972 S   1.3  1.6 258:41.70 toolpack_engine
3690 root      20   0 2543928 109644   6904 S   1.3  1.4 320:42.86 gateway
3181 root      20   0   10876    672    536 S   1.0  0.0 224:56.18 ipwatchd
Here we see the processor usage is 70% idle.
We also see the tbrouter application is at 101% CPU, which is normal. You can have more details here: Toolpack_Application:tbrouter