tbsigtrace: Signaling trace capture tool
tbsigtrace is a debug tool that is use to collect signalling protocol messages. It can trace SS7, ISDN, SIP, Sigtran and H.248 messages and put it in a wireshark format. It can also capture CAS traces in a text format
Contents |
How to use it
Connect SSH to the unit and type
tbsigtrace
This will capture all protocols available on the units. It will create one pcap file per protocol. To stop the application, type 'q'.
The output files are located here: /lib/tb/toolpack/setup/12358/[major version]/apps/tbsigtrace and can be retrieved with a sFTP tool.
To capture live signaling traces to wireshark see: Live Signaling capture
More details on using the tbsigtrace application
Options available:
- -d Daemon mode
- -name XYZ Application name
- -db Not used
- -c XYZ Configuration file to load
- -gw XYZ SystemId (i.e. 12358)
- -adapter TBXYZ Adapter name to connect or "all" to connect to all adapter in the system
- -ss7 Default ss7 trace activation
- -isdn Default isdn trace activation
- -old Isdn trace in cap file with lapd layer
- -ip Default ip trace activation (sip, sigtran and iua)
- -h248 Default h248 trace activation
- -lapd Default lapd trace activation
- -cas Default cas trace activation
- -cap CAP format enabled
- -format TXT format enabled
- -single Create one file by signaling entity
- -regroup Regroup identical signaling entity types in one file
- -L XYZ Specify which link will be captured. The name if found in the web configuration (ISDN_0 for example)
Examples
This will gather all ss7 links from one blade and put this in a single cap file
tbsigtrace -ss7
This will gather all isdn links and put them in on files
tbsigtrace -isdn
This will gather all isdn links with lapd layer and put them in separate text files
tbsigtrace -isdn -old -format
This will gather all sip traces from the default gateway port and specific unit and put them in a single cap file
tbsigtrace -gw 12358 -adapter TB000544 -ip
This will gather all h248 messages on the system and put this in a single cap file
tbsigtrace -h248
This will gather all IUA (ip and tdm sides) messages on the system and put this in a single cap file
tbsigtrace -ip -lapd
How to interpret the data
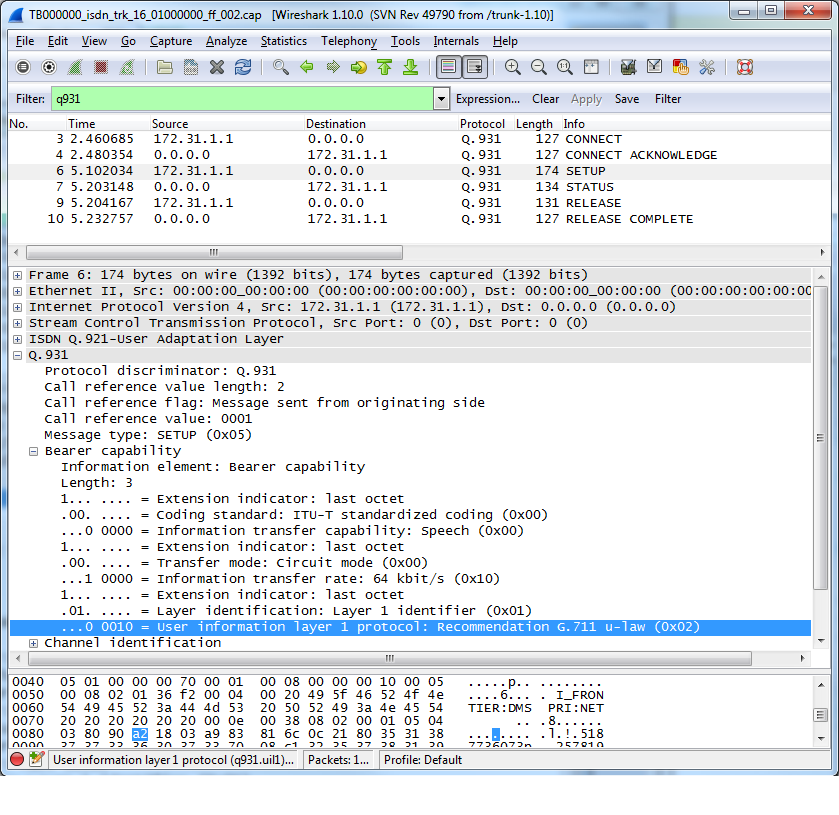
When using wireshark (http://www.wireshark.org/) to analyze the captured data (in pcap format), you can apply multiple filters to scope your analysis around relevant data. For example, in the following picture, you can see that the 'q931' filter was applied to show only ISDN-related packets. Other userful keywords are here:
- SIP: sip || rtp
- ISDN: q921 || q931
- SS7: mtp2 || mtp3 || isup
- SCTP: sctp
- Sigtran IUA: iua
- Sigtran M2UA: m2ua
- Sigtran M2PA: m2pa
- Sigtran M3UA: m3ua
- H.248: megaco
Be aware however that the pcap format is usually a container for "packet" data. So, when TDM protocol such as ISDN or SS7 (non-sigtran) traffic is captured, tbsigtrace wraps the protocol around fake protocols layers (i.e. Ethernet/IP/SCTP) for wireshark to be able to open it and analyze it. Again, in the picture below, you can see these fake layers that were inserted since the capture was made from a TDM link (T1) with the regular Q.921 (HDLC) transport protocol. These layers have been stripped and replaced by Ethernet/IP/SCTP.
Beside being able to use wireshark for analysis, these fake layers may also carry useful information. For example, when looking at an ISDN capture, the fake-SCTP layer will contain the network-variant (e.g. DMS, NET5, etc) from which the capture was made. Another useful information is contained in the fake-IP source and destination addresses:
- when (Src=w.x.y.z and Dst=0.0.0.0) it means an egress (outgoing) message.
- when (Src=0.0.0.0 and Dst=w.x.y.z) it means an ingress (incoming) message.
WARNING: tbsigtrace application should not be used all the time, otherwise it will reduce performance and fill completely your hard drive.
