Toolpack:Configuring Call Trace B
Candy Chan (Talk | contribs) m (Typo) |
(Fix incorrect menu in "Enabling Call Trace") |
||
| Line 20: | Line 20: | ||
'''This procedure only needs to be carried out one time for each system.''' | '''This procedure only needs to be carried out one time for each system.''' | ||
| − | 1- Select ''' | + | 1- Select '''Applications''' in the navigation menu. |
| − | [[Image: | + | [[Image:ConfigureCallTrace_9_A.png]] |
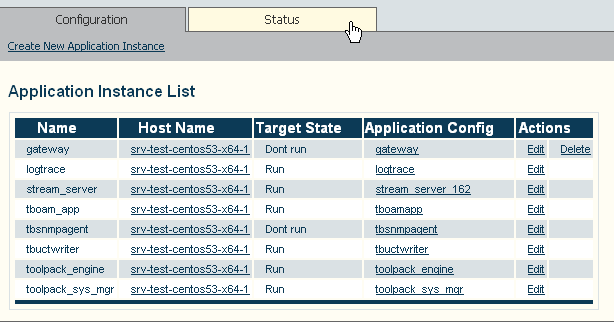
2- Select the '''Status''' tab. | 2- Select the '''Status''' tab. | ||
Revision as of 01:22, 25 March 2014
Applies to version v2.7
Call Trace is a diagnostic tool that is designed to trace the path a call takes through a Tmedia system, and to provide information about numerous aspects of the call path, such as:
- The routing decision
- The outgoing call
- Subsequent outgoing calls, in the case of a route retry
- Parameters selected for a SIP SDP
- The SIP Call-id
- The trunk and timeslot chosen for TDM protocols
- The termination result code, and more.
A call path is shown as separate call legs, distinguishing the incoming portion with other portions of a call. Call trace enables a default of 10,000 call legs to be stored in the system and to be viewed using the Web Portal.
Calls may be filtered by called number, calling number, Network Access Point (NAP), time of day range, protocol and direction.
This procedure only needs to be carried out one time for each system.
1- Select Applications in the navigation menu.
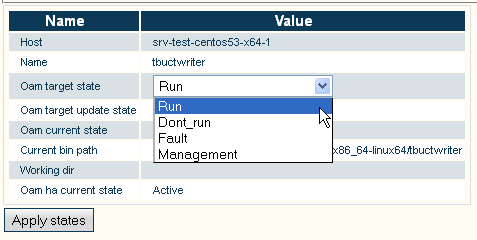
3- Select Run
- Click Apply States
Retrieving calls:
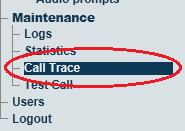
1- Click Call Trace in the navigation panel
2- Set various parameters for the call trace, such as
- Time and date range
- Called or calling number
- Network Access Point (NAP)
- Incoming or outgoing calls
- Call Duration, Reason Code
Once you are satisfied with the filter criteria, click Apply
The filter results are displayed.
3-Select a call in the results window to display further information about the call.
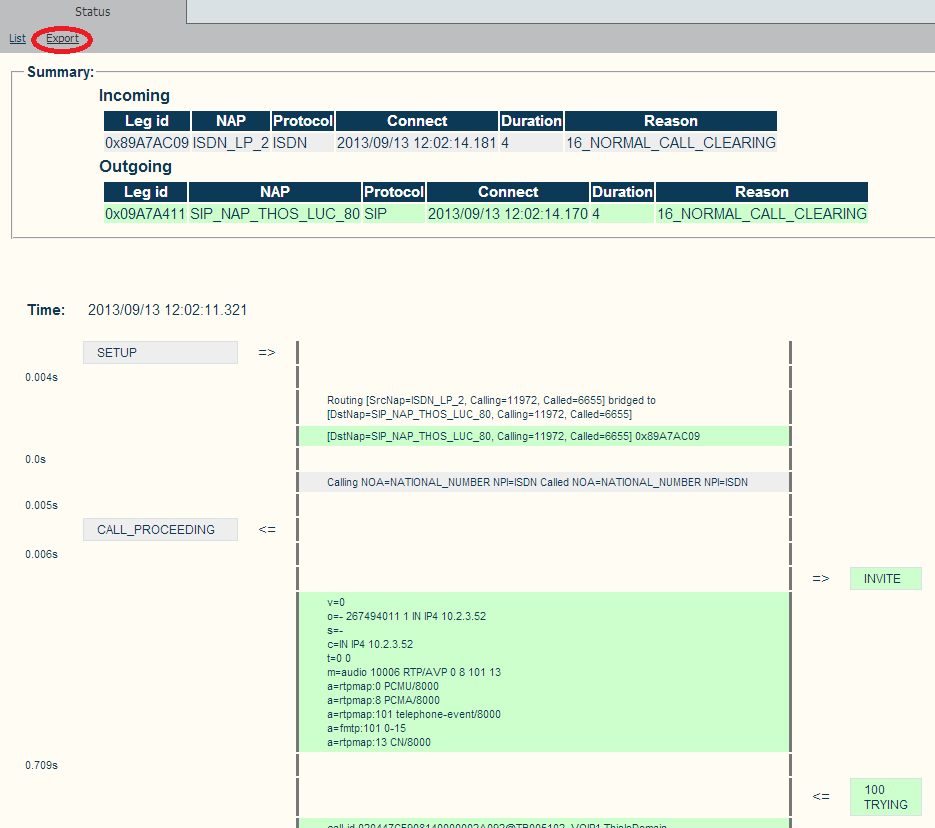
4- Choose the concerned call entry to view the details.
5- You can click export to save the call trace as a HTML file.
By default, the system stores up to 10,000 call legs in memory. If the call is no longer in memory, it may be retrieved by using information from the uctdata log files.
By default the file is located in the following path:
/lib/tb/toolpack/setup/12358/2.6/apps/tbuctwriter/uctdata*
1- Start tbx_cli_tools_remote 2- Select tbuctwriter 3- To know which files are available, as well as the start and end time of each file, use the following options:
- 'p' to print all uctdata files on disk
To load a file into memory for viewing with the Web Portal:
- Option 'o' followed by the data filename (uctdata*)
Use the Web Portal to search for calls using the appropriate filter criteria. The memory will not be overwritten until you restore normal process.
To restore normal process:
- Option ‘c’ to clear memory
- Option ‘l’ to have calls put in memory again


