Toolpack:System Status A
From TBwiki
(Difference between revisions)
m |
|||
| (12 intermediate revisions by one user not shown) | |||
| Line 1: | Line 1: | ||
{{DISPLAYTITLE:Web Portal 2.8: System Status}} | {{DISPLAYTITLE:Web Portal 2.8: System Status}} | ||
| − | |||
__NOTOC__ | __NOTOC__ | ||
=General System Status View= | =General System Status View= | ||
| − | The Web Portal configuration tool presents a | + | The Web Portal configuration tool presents a high-level view of system status, from which similar features or interfaces are grouped under common tabs for faster viewing. To highlight status, tabs display colors to indicate a general sense of system health. The colors used are: |
| + | |||
| + | * <span style="background:#00ff00"> Green </span>: All is okay. | ||
| + | * <span style="background:#ffff00"> Yellow </span>: Warning. In some cases, capacity may need to be reduced. The system is still operating. | ||
| + | * <span style="background:#ff0000"> Red </span>: Major fault. Some, or all, services or resources are not accessibale. | ||
| + | * <span style="color:#FFFFFF; background:#808080"> Grey </span>: The features, represented by the tab, are not configured. | ||
[[Image:StatusGeneral_0.png|900px]] <br><br> | [[Image:StatusGeneral_0.png|900px]] <br><br> | ||
| − | Selecting a specific tab, provides a detailed | + | Selecting a specific tab, provides a detailed view of status. |
[[Image:StatusGeneral_1.png|900px]] <br><br> | [[Image:StatusGeneral_1.png|900px]] <br><br> | ||
| − | + | =Detailed Status Views= | |
| − | + | ||
| − | + | ||
| − | + | ||
| − | + | ||
| − | + | ||
| − | + | ||
| − | + | ||
| − | + | ||
| − | + | ||
| − | + | ||
| − | |||
{| cellpadding="5" border="1" class="wikitable" | {| cellpadding="5" border="1" class="wikitable" | ||
|- | |- | ||
| Line 34: | Line 27: | ||
|} | |} | ||
| − | + | ||
{| cellpadding="5" border="1" class="wikitable" | {| cellpadding="5" border="1" class="wikitable" | ||
|- | |- | ||
| Line 43: | Line 36: | ||
|} | |} | ||
| − | + | ||
{| cellpadding="5" border="1" class="wikitable" | {| cellpadding="5" border="1" class="wikitable" | ||
|- | |- | ||
| Line 52: | Line 45: | ||
|} | |} | ||
| − | + | ||
{| cellpadding="5" border="1" class="wikitable" | {| cellpadding="5" border="1" class="wikitable" | ||
|- | |- | ||
| Line 61: | Line 54: | ||
|} | |} | ||
| − | + | ||
{| cellpadding="5" border="1" class="wikitable" | {| cellpadding="5" border="1" class="wikitable" | ||
|- | |- | ||
| Line 70: | Line 63: | ||
|} | |} | ||
| − | + | ||
{| cellpadding="5" border="1" class="wikitable" | {| cellpadding="5" border="1" class="wikitable" | ||
|- | |- | ||
| Line 79: | Line 72: | ||
|} | |} | ||
| − | + | ||
{| cellpadding="5" border="1" class="wikitable" | {| cellpadding="5" border="1" class="wikitable" | ||
|- | |- | ||
| Line 88: | Line 81: | ||
|} | |} | ||
| − | + | ||
{| cellpadding="5" border="1" class="wikitable" | {| cellpadding="5" border="1" class="wikitable" | ||
|- | |- | ||
| Line 94: | Line 87: | ||
|- | |- | ||
| valign="top" | | | valign="top" | | ||
| − | * [[ | + | * [[Toolpack:Generating_Graphs_B|Generating Graphs]] |
|} | |} | ||
| − | + | ||
{| cellpadding="5" border="1" class="wikitable" | {| cellpadding="5" border="1" class="wikitable" | ||
|- | |- | ||
| Line 103: | Line 96: | ||
|- | |- | ||
| valign="top" | | | valign="top" | | ||
| − | * [[ | + | * [[Toolpack:Accessing_Audit_Logs_B|Working with Audit Logs]] |
|} | |} | ||
Latest revision as of 16:33, 20 November 2015
General System Status View
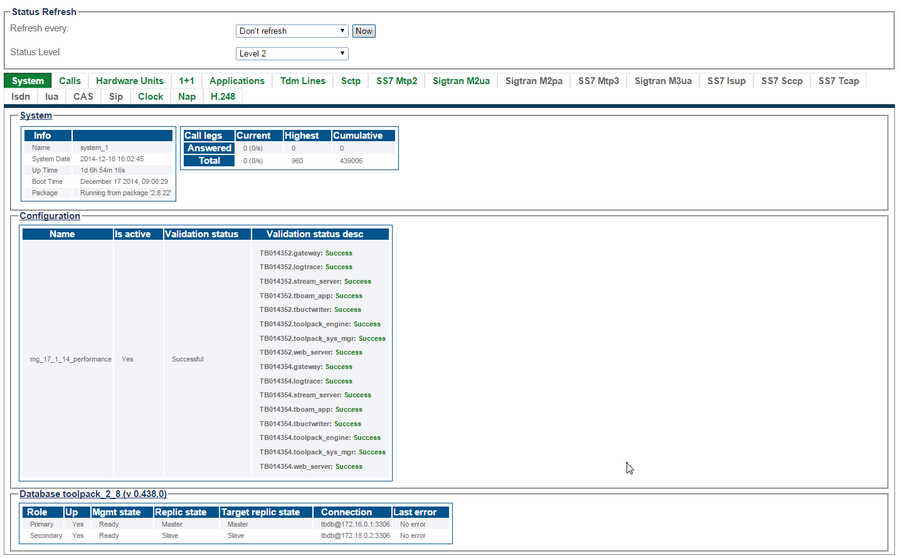
The Web Portal configuration tool presents a high-level view of system status, from which similar features or interfaces are grouped under common tabs for faster viewing. To highlight status, tabs display colors to indicate a general sense of system health. The colors used are:
- Green : All is okay.
- Yellow : Warning. In some cases, capacity may need to be reduced. The system is still operating.
- Red : Major fault. Some, or all, services or resources are not accessibale.
- Grey : The features, represented by the tab, are not configured.
Selecting a specific tab, provides a detailed view of status.
Detailed Status Views
| Host Roles |
|---|
| User Access |
|---|
| Database Backup |
|---|
| SNMP |
|---|
| System Configuration |
|---|
| Package Upgrades |
|---|
| Software Licenses |
|---|
| Statistics |
|---|
| Audit Logs |
|---|

