Toolpack:System Status C
From TBwiki
(Difference between revisions)
m (→Detailed Status Views) |
|||
| (2 intermediate revisions by one user not shown) | |||
| Line 60: | Line 60: | ||
| valign="top" | | | valign="top" | | ||
* [[Verify SNMP Application_A|Verify SNMP Application]] | * [[Verify SNMP Application_A|Verify SNMP Application]] | ||
| + | |} | ||
| + | |||
| + | |||
| + | {| cellpadding="5" border="1" class="wikitable" | ||
| + | |- | ||
| + | ! width="200" style="background: none repeat scroll 0% 0% rgb(239, 239, 239); -moz-background-inline-policy: continuous;" | Telephony Services | ||
| + | |- | ||
| + | | valign="top" | | ||
| + | * [[Verify Telephony Services_A|Verify Telephony Services]] | ||
|} | |} | ||
Latest revision as of 17:46, 8 February 2017
General System Status View
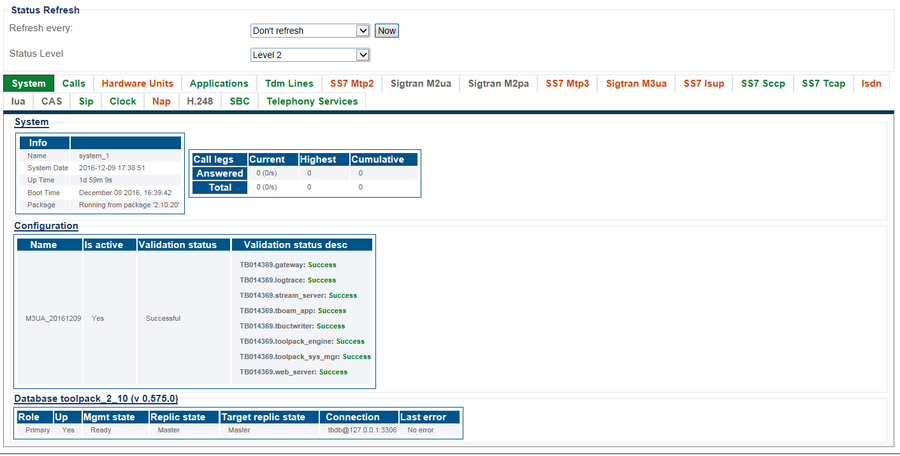
The Web Portal configuration tool presents a high-level view of system status, from which similar features or interfaces are grouped under common tabs for faster viewing. To highlight status, tabs display colors to indicate a general sense of system health. The colors used are:
- Green : All is okay.
- Yellow : Warning. In some cases, capacity may need to be reduced. The system is still operating.
- Red : Major fault. Some, or all, services or resources are not accessibale.
- Grey : The features, represented by the tab, are not configured.
Selecting a specific tab, provides a detailed view of status.
Path
/systems/@[system_name]/status
Detailed Status Views
| Host Roles |
|---|
| User Access |
|---|
| Database Backup |
|---|
| SNMP |
|---|
| Telephony Services |
|---|
| System Configuration |
|---|
| Package Upgrades |
|---|
| Software Licenses |
|---|
| Statistics |
|---|
| Audit Logs |
|---|

