Toolpack:Generating Graphs B
From TBwiki
(Difference between revisions)
m (→Applies to version v2.8) |
m |
||
| (4 intermediate revisions by one user not shown) | |||
| Line 1: | Line 1: | ||
| − | === '''''Applies to version v2.8''''' === | + | === '''''Applies to version(s) v2.8, v2.9, v2.10, v3.0, v3.1''''' === |
{{DISPLAYTITLE:Generating Graphs}} | {{DISPLAYTITLE:Generating Graphs}} | ||
| Line 26: | Line 26: | ||
2- Choose the statistics to display as graphs: | 2- Choose the statistics to display as graphs: | ||
* Select one or more statistics from the '''Statistics to display''' window. | * Select one or more statistics from the '''Statistics to display''' window. | ||
| − | * Click '''Generate | + | * Click '''Generate Graphs'''. |
Latest revision as of 12:28, 24 April 2019
Applies to version(s) v2.8, v2.9, v2.10, v3.0, v3.1
The global polling statistics setting can be displayed in graph format.
To display the polled system statistics:
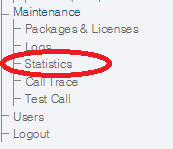
1- Click Statistics in the navigation panel
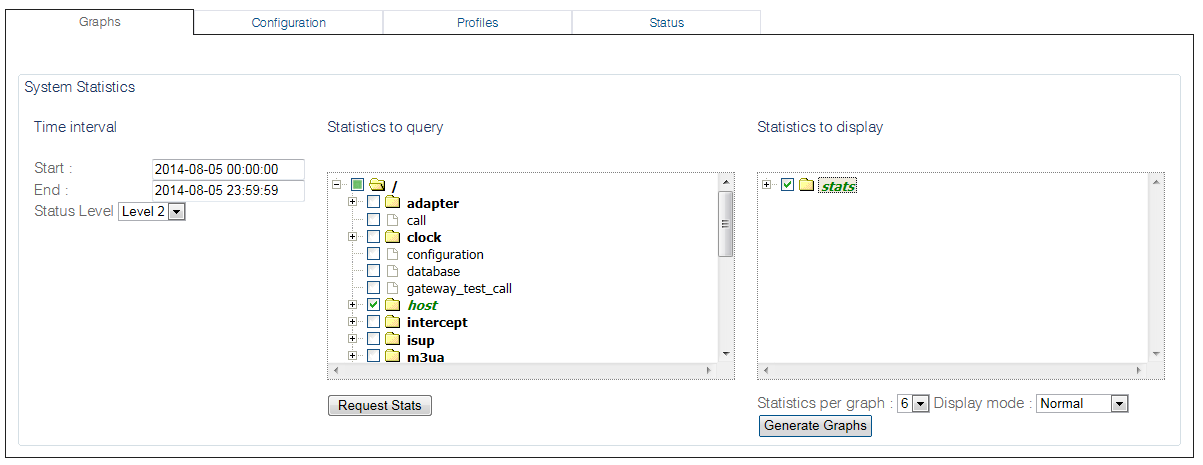
2- Select the statistics to run a query on as follows:
- Enter a start date and time.
- Enter a stop date and time.
- Select a status level.
- Select one or more statistics from the Statistics to query window
- Click Request Stats.
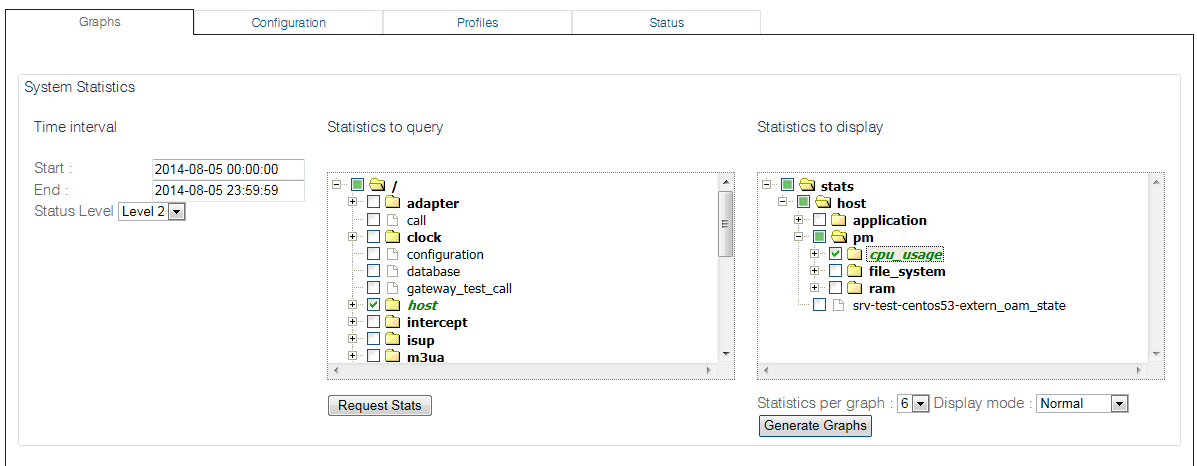
2- Choose the statistics to display as graphs:
- Select one or more statistics from the Statistics to display window.
- Click Generate Graphs.
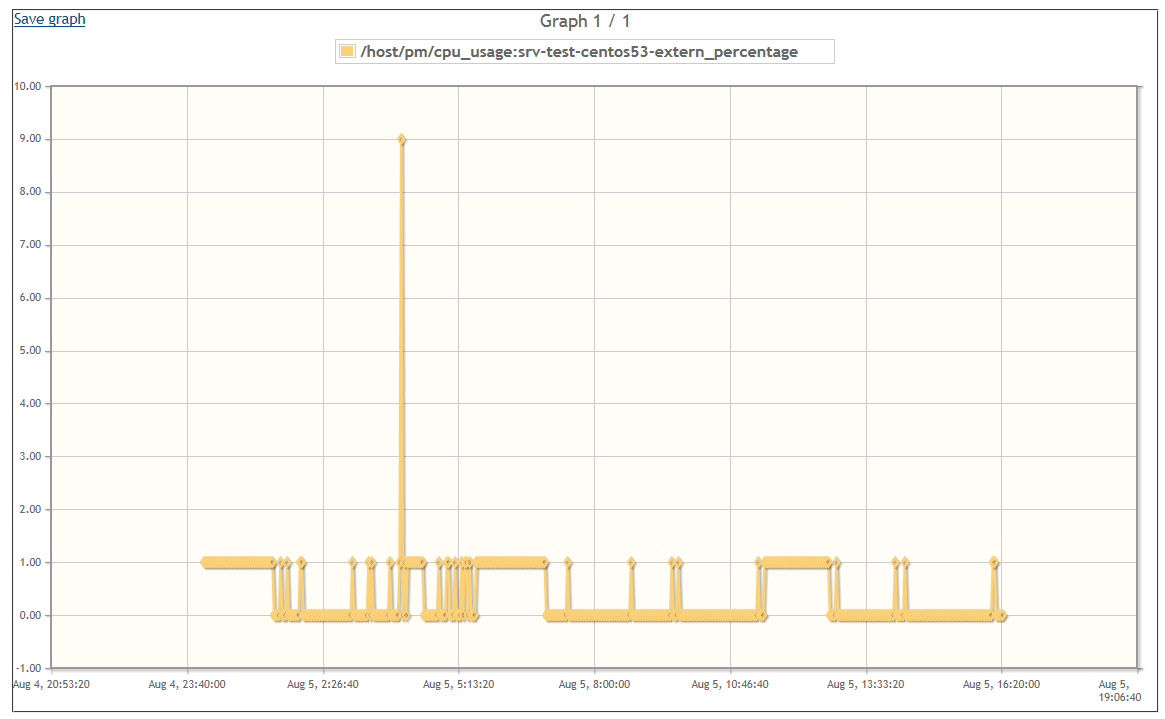
The graph is displayed.


