Toolpack monitoring
m (→Built-in monitoring analyzers) |
(fix link) |
||
| Line 1: | Line 1: | ||
| − | The [[Tmonitor]] and [[Tmedia]] products both support [[Network_monitoring]]. | + | The [[Tmonitor]] and [[Tmedia]] products both support [[Network_monitoring|Network Monitoring]]. |
Monitoring features can be controlled with the [[Toolpack API]]. | Monitoring features can be controlled with the [[Toolpack API]]. | ||
Revision as of 13:26, 22 April 2016
The Tmonitor and Tmedia products both support Network Monitoring.
Monitoring features can be controlled with the Toolpack API.
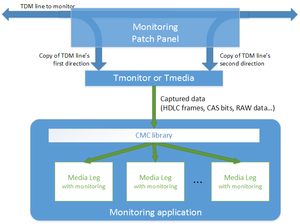
Using these APIs, the Toolpack Gateway application supports built-in protocol analyzers that allow to monitor a TDM network, generate CDR logs and notify external applications of monitored TDM calls.
Contents |
The Toolpack Monitoring API
The Toolpack monitoring API consists of function calls on the call leg class:
- StartMonitoring
- StopMonitoring
Corresponding events notify the call flow of monitoring state
- OnMonitoringStarted
- OnMonitoringDataReceived
An application that need to do monitoring will first allocate media legs on the appropriate Line Service and Timeslot, then use the StartMonitoring function call to configure the monitoring parameters. Among parameters, will be chosen:
- Mode (HDLC, SS7, CAS, RAW)
- Rate (64Kbps, 56Kbps, 48Kbps, 32Kbps, 16Kbps or 8Kbps)
- Timeslot sub-index (for rates of 32Kbps or less)
Once monitoring is started, the application (call flow) will be notified of captured data through OnMonitoringDataReceived.
For more information on this API, please refer to the following article, which covers the monitoring APIs: Working with CMC Call Legs
For more general information about using call legs in your application, please refer to this article: Working with Call Legs
Built-in monitoring analyzers
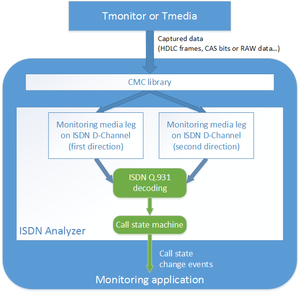
The Toolpack framework includes "analyzer" classes that use the monitoring API to capture signaling messages on TDM links.
The ISDN Analyzer will capture HDLC messages on the IDSN D-Channel, and analyze them to rebuild the call state of monitored ISDN calls.
The user application can then be notified of a detected ISDN calls, and of any state change of this call (accepted, alerting, answered, terminating, terminated...).
For more information about the analyzer API, refer to appropriate header files in Toolpack source code.
Integration of monitoring analyzers in Toolpack Gateway
The analyzers are integrated into Toolpack's own Gateway application. The Gateway application can be configured to monitor ISDN calls on the specified Line Services.
Upon detection of ISDN calls, the Gateway application can generate CDR logs, and also forward the information to "generators" that will generate message toward an external application that needs to be notified of monitored ISDN calls.
For information about the configuration of ISDN analyzers in Toolpack, please refer to the following article: Toolpack ISDN Analyzer
Toolpack monitoring generators
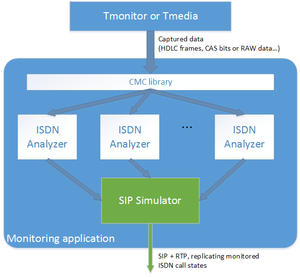
The Gateway application can attach "generators" to analyzers. A "generator" is receiving the analyzer's detected calls state changes, and generates corresponding events toward an external application.
Toolpack SIP simulator
One of the "generators" provided with Toolpack is the "SIP Simulator".
This monitoring generator is
- simulating SIP messages that correspond to the ISDN state changes
- Forwarding captured TDM audio through RTP streams
Using this SIP simulator with a monitoring analyzer allows any SIP monitoring software to be able to monitor a TDM link (ISDN for example).
For information about the configuration of "SIP Simulators" in Toolpack, please refer to the following article: Toolpack SIP Simulator


