Toolpack:Retrieving Call Trace C
Lucas Joyal (Talk | contribs) (→View detailed call traces for a call) |
Lucas Joyal (Talk | contribs) (→Dropping an active call - completing the steps) |
||
| Line 27: | Line 27: | ||
====Dropping an active call==== | ====Dropping an active call==== | ||
| + | Active calls can be manually interrupted via the results window. | ||
| − | 1- | + | 1- Find the call to drop in the results window. |
| + | 2a - Click on the 'Drop Call' link under the 'Action' column. | ||
| + | |||
| + | 2b - Alternatively, you can select the call you want in the result windows and drop it via the the top-left link 'Drop Call'. | ||
| + | |||
| + | 3 - The call will be dropped. The page might need to be refresh after the command, since the dropping process might not be completed immediately after the first refresh. | ||
====View detailed call traces for a call==== | ====View detailed call traces for a call==== | ||
Revision as of 14:05, 13 November 2017
Contents |
Applies to version(s) v3.0
Retrieving calls from memory
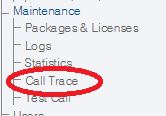
1- Click Call Trace in the navigation panel
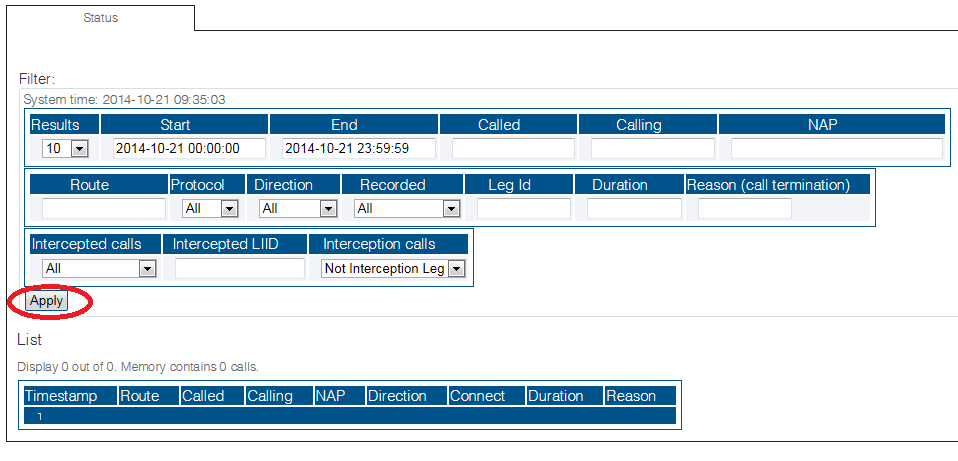
2- Set various parameters for call trace, such as
- Time and date range
- Called or calling number
- Network Access Point (NAP)
- Incoming or outgoing calls
- Call Duration, Reason Code
- Active call
Once you are satisfied with the filter criteria, click Apply
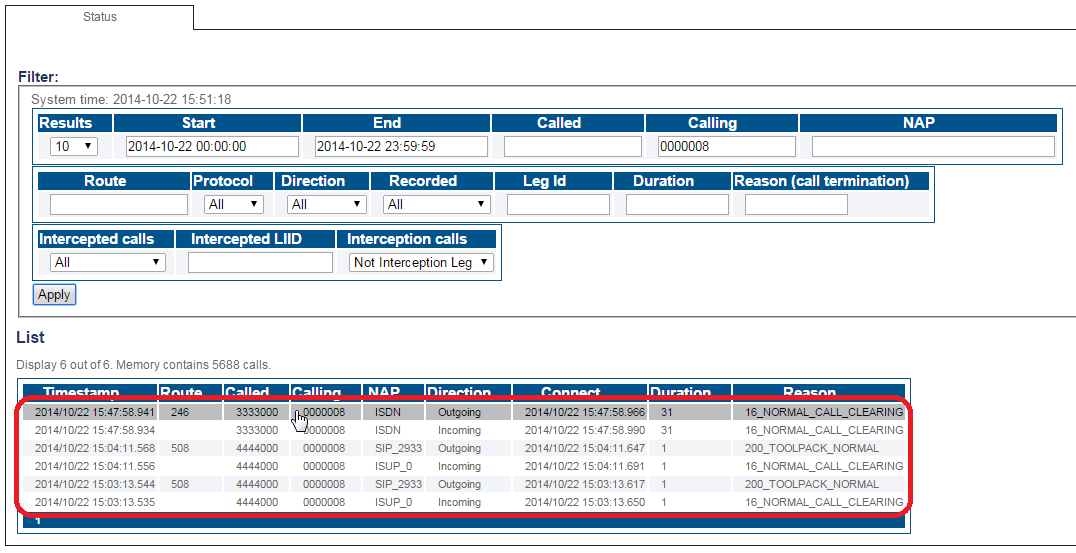
The filter results are displayed.
Dropping an active call
Active calls can be manually interrupted via the results window.
1- Find the call to drop in the results window.
2a - Click on the 'Drop Call' link under the 'Action' column.
2b - Alternatively, you can select the call you want in the result windows and drop it via the the top-left link 'Drop Call'.
3 - The call will be dropped. The page might need to be refresh after the command, since the dropping process might not be completed immediately after the first refresh.
View detailed call traces for a call
1- Select a call in the results window to display further information about the call.
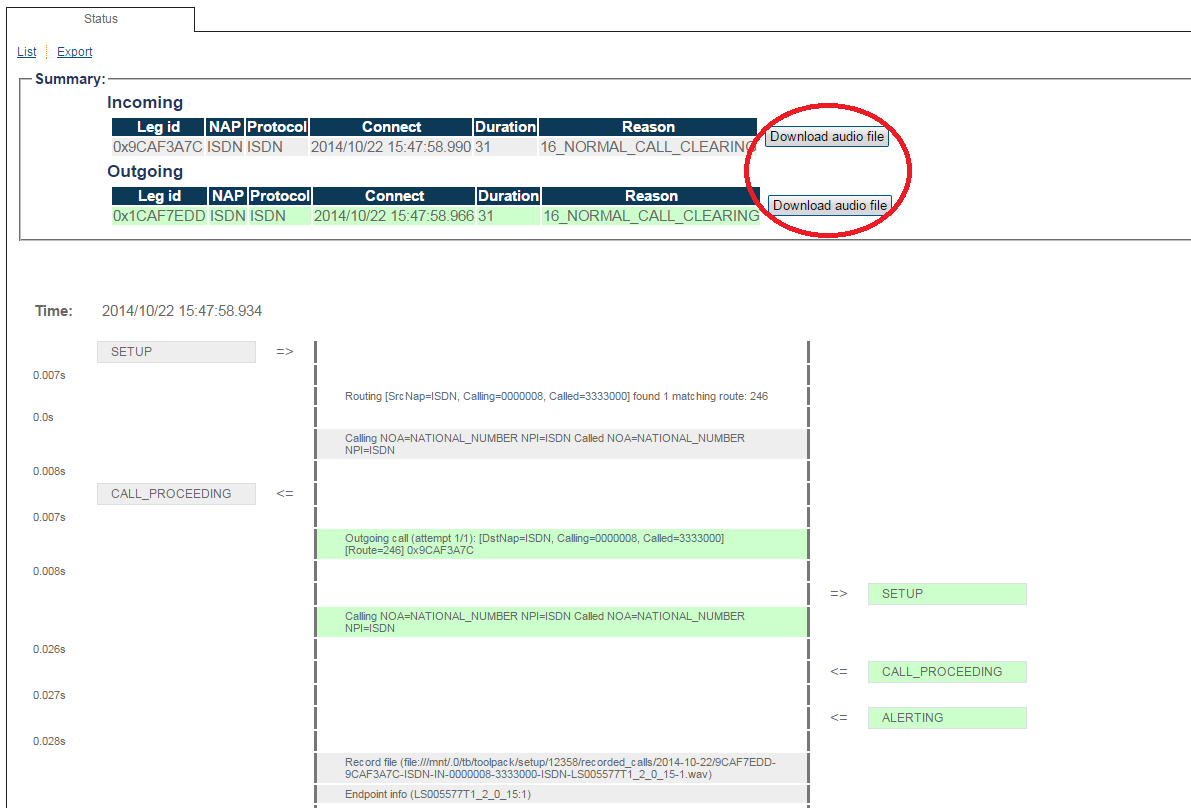
2- Choose the concerned call entry to view the details.
- Click Download Audio File
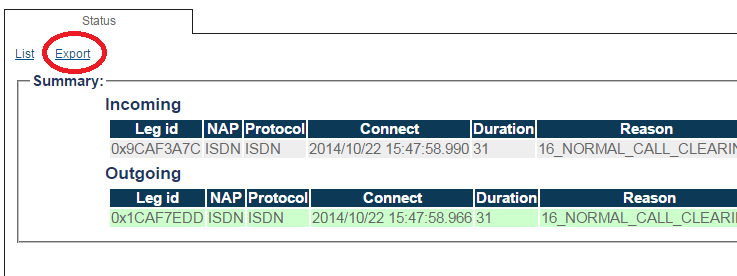
3- You can choose to export the call trace file as an HTML file.
- Click Export
4- For active calls, you can also choose to drop the call.
- Click Drop call
Retrieving calls from files
By default, the system stores up to 10,000 call legs in memory. If the call is no longer in memory, it may be retrieved by using information from the uctdata log files. To search for calls that are no longer in memory, do the following:
1- Start tbx_cli_tools_remote
2- Select tbuctwriter
3- To know which files are available, as well as the start and end time of each file, use the following options:
- 'p' to print all uctdata files on disk
To load a file into memory for viewing with the Web Portal:
- Option 'o' followed by the data filename (uctdata*)
Use the Web Portal to search for calls using the appropriate filter criteria. The memory will not be overwritten until you restore normal process.
To restore normal process:
- Option ‘c’ to clear memory
- Option ‘l’ to have calls put in memory again
By default the file is located in the following path:
/lib/tb/toolpack/setup/12358/2.8/apps/tbuctwriter/uctdata*
