Toolpack:Configuring Call Trace A
(Created page with "Unique call trace (uct) was created to trace the callflow from any incoming call through the Tmedia system. It allows to see the incoming call, the routing decision, outgoing ...")
Newer edit →
Revision as of 17:23, 25 October 2012
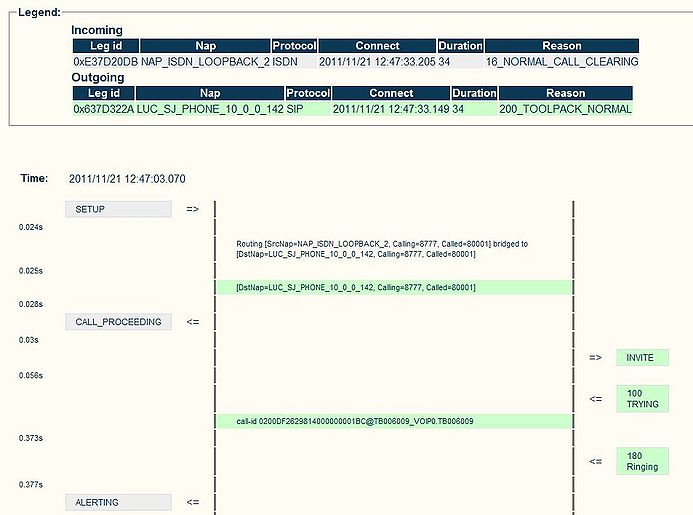
Unique call trace (uct) was created to trace the callflow from any incoming call through the Tmedia system. It allows to see the incoming call, the routing decision, outgoing calls, other outgoing calls if there is route retry, the parameters selected for SIP SDP, the SIP Call-id, the trunk and timeslot chosen for TDM protocols, the termination result code, and more.
It allows to store information for long periods of time and search for calls in history. The last 10,000 call legs (default size) can be seen directly in the web portal. Older logs can be loaded and viewed on the same system, or exported to other systems. Once a specific call has been consulted, it will remain in memory for a longer period of time, so that it can be consulted later on.
Calls to view can be filtered according to called number, calling number, Network Access Point (NAP), time of day range, protocol and direction.
Contents |
To start Unique Call Trace
From the web interface:
Applications -> Instances -> Status tab -> tbuctwriter -> Oam target state [Run]
To modify application configuration (like trace level and memory size):
Applications -> Configurations -> tbuctwriter [Edit]
Systems -> Activate Configuration
To see logs
From the web interface:
Call Trace
Call Filters
Calls can be filtered using the following information:
- Time and date range
- Called or calling number
- Network Access Point (NAP)
- Incoming or outgoing calls
- Call Duration, Reason Code
You can then select the call to see and it will display information about the calls.
How to search for calls no longer in Memory
The system will store a number of calls in memory and the search can be done directly from the web interface using Call Trace.
If the call is no longer in memory you can retrieve the information from the uctdata log files.
The default file location is here:
/lib/tb/toolpack/setup/12358/2.6/apps/tbuctwriter/uctdata*
First, start tbx_cli_tools_remote, select tbuctwriter
To know which files are available and the start and end time of each file:
- Option 'p' to print all uctdata files on disk
To load a file in memory to be seen from Web (live calls continue to be captured to files):
- Option 'o' with the data filename (uctdata*)
Once done, you can go back in the Web portal and select Call Trace from the menu on the left. You can search for calls using the filters. The memory will not be overwritten until you restore normal process.
To restore normal process:
- Option ‘c’ to clear memory
- Option ‘l’ to have calls put in memory again
Note: Unique Call Trace (UCT) is available starting with release 2.6

