Tmedia, Tdev, and Tsig Web Portal 2.10: System Status
From TBwiki
General System Status View
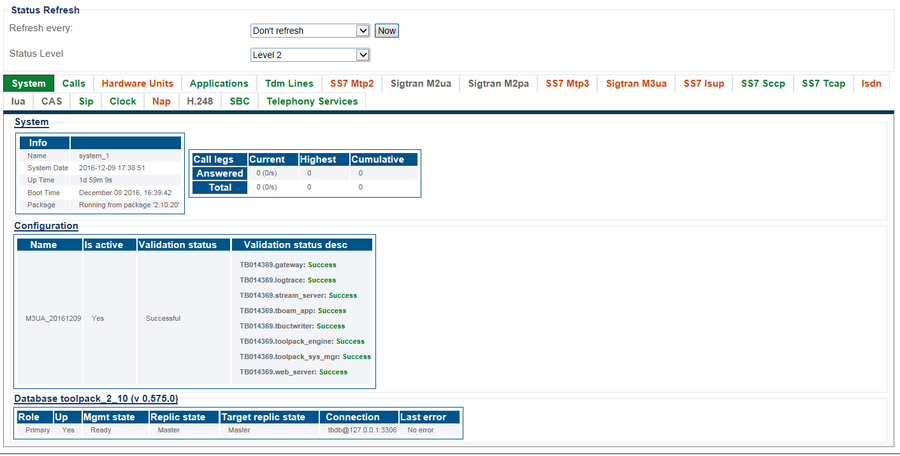
The Web Portal configuration tool presents a high-level view of system status, from which similar features or interfaces are grouped under common tabs for faster viewing. To highlight status, tabs display colors to indicate a general sense of system health. The colors used are:
- Green : All is okay.
- Yellow : Warning. In some cases, capacity may need to be reduced. The system is still operating.
- Red : Major fault. Some, or all, services or resources are not accessibale.
- Grey : The features, represented by the tab, are not configured.
Selecting a specific tab, provides a detailed view of status.
Path
/systems/@[system_name]/status
Detailed Status Views
| Host Roles |
|---|
| User Access |
|---|
| Database Backup |
|---|
| SNMP |
|---|
| Telephony Services |
|---|
| System Configuration |
|---|
| Package Upgrades |
|---|
| Software Licenses |
|---|
| Statistics |
|---|
| Audit Logs |
|---|

