Excessive calls beyond preset value on FreeSBC/ProSBC system
Contents |
What happens when too many calls on FreeSBC/ProSBC
FreeSBC/ProSBC is defined with certain number of SIP call sessions at the time of initial installation of the FreeSBC/ProSBC. This SIP call session is chosen by user to suit his or her SBC applicaton, and it can be increased through administrative mean later if required for ProSBC. If this value is exceeded by the number of SIP calls coming into FreeSBC/ProSBC system, for example, system is configured with 2000 sesions (or 4000 SIP UA Call), and if a SIP INVITE coming in and trying to establish the 2001st session call, the following will happen:
- Excessive calls are dropped due to "congestion"
- A start of congestion will be indicated in FreeSBC/ProSBC system log
- By default, SIP "503 Service unavailable" release cause is sent to the incoming side where the source SIP end point initiating the INVITE, and the incoming call is dropped. This default release cause can be re-configured to other value if needed, see Reason Cause Mapping.
- In most cases, the SIP NAP is set to allow infinite Maximum simultaneous incoming calls and Maximum simultaneous incoming calls. See call rate limiting in NAP, and this is by deafult. In this case, if congestion will ever occur, it is caused by the new calls that exceeding SIP sessions (or SIP UA Call) assigned.
- If call rate limiting is set to a certain value other than infinite, the congestion can be induced by calls exceeding this value and not necessarily by calls exceeding SIP sessions (or SIP UA Call) assigned
- There will be a warning in web portal when calls are dropped due to congestion, and alerts/notices before resources have been used up
- Usage percentage. SIP NAP will always have usage percentage as 0, as SIP NAPs' resources are shared among SIP stack resource/SIP channels/SIP UA calls assigned.
- Shared usage percentage. This will indicate what percentage in relation of total SIP stack reources/SIP channels/SIP UA calls assigned
- There are also statistics in the NAP that indicate the number of calls dropped for each release cause (including for congestion) so one can know if the congestion situation had ever occurred. See Call congestion period dropped calls in below
- There is a SNMP field for NAP's percentage usage, see tbNapAvailablePercent and tbNapUsagePercent in TB-MIB, and see SNMP. Normally, when SIP NAP is up, it is marked 100% availability, when congestion occurs, and SIP NAP will become no longer available and the availibilty percentage will become 0.
- There is no SNMP trap for this by default for this field, but one can be added by editing a configuration file if necessary. Or a shell script can be used to poll NAP's usage percentage and send whatever alert (email or other) when appropriate. See Tbstatus Application and Tbstatus monitoring.
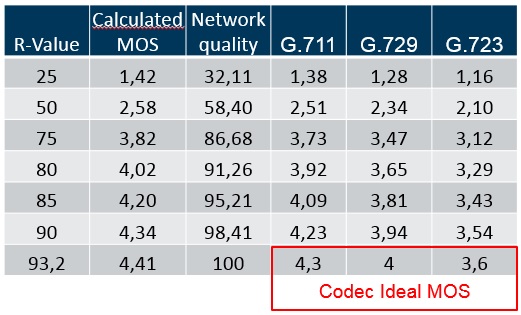
Toolpack uses a well-known model to evaluate a MOS value based on collected statistics for a call. There are 3 factors that significantly impact the call quality: latency, packet loss and jitter of RTP packets. Using these statistics, we calculate an R-value that ranges from 1 to 100 where a higher number is better. Finally the MOS is calculated using this formula.
MOS = 1 + 0.035R + ((R - 60) * (100 – R) * 0.000007R)
TelcoBridges' MOS Implementation
For the MOS calculated from the R-value, there is no notion of codec. We decided to apply a ratio in relation to the codec's ideal MOS.
See the table below:
Network quality
TelcoBridges' MOS implementation adds another concept over the standard MOS: Network quality. The network quality parameter provides a fast way to identify a bad network condition. The MOS is useful when comparing calls for the same NAP or for the same network. But if you are using several codecs, the MOS value might be misleading to detect network problems.
- Examples:
- A perfect network (i.e. no packet loss, no latency) using G.723 will have a MOS of 3.6. This is relatively low, but it represents a network quality of 100%. The only way to improve the MOS will be to use a higher quality codec.
- On the other hand, a G.711 call with a MOS of 3.7 represents a network quality of 86%. This rather low and based on these values, you know there is something that can be improved in the network.
Ingress-Egress
There are 2 MOS values calculated per call leg. The ingress value is using RTP reception statistics and the egress value is using RTCP statistics received from the peer. Using these statistics, w can calculate MOS and network quality for the ingress and egress directions.
When using Call Trace, the lowest value between ingress and egress MOS and network quality are displayed.
