Excessive calls beyond preset value on FreeSBC/ProSBC system
From TBwiki
Revision as of 00:49, 28 February 2020 by William Wong (Talk | contribs)
What happens when too many calls on FreeSBC/ProSBC
FreeSBC/ProSBC is defined with certain number of SIP call sessions at the time of initial installation of the FreeSBC/ProSBC. This SIP call session value is chosen by user to suit his or her SBC applicaton, and it can be increased through administrative mean later if required for ProSBC. If this value is exceeded by the number of SIP calls coming into FreeSBC/ProSBC system, for example, system is configured with 2000 sesions (or 4000 SIP UA Call), and if a SIP INVITE coming in and trying to establish the 2001st session call, the following will happen,
Excessive calls are dropped due to "congestion
- A start of congestion will be indicated in FreeSBC/ProSBC system log
- By default, SIP "503 Service unavailable" release cause is sent to the incoming side from where the source SIP end point initiating the INVITE, and the incoming call is dropped. This default release cause can be re-configured to other value if needed, see Reason Cause Mapping.
- In most cases, the SIP NAP is set to allow infinite Maximum simultaneous incoming calls and Maximum simultaneous incoming calls. See call rate limiting in NAP, and this is by deafult. In this case, if congestion will ever occur, it is caused by the new calls that exceeding SIP sessions (or SIP UA Call) assigned.
- If call rate limiting is set to a certain value other than infinite, the congestion can be induced by calls exceeding this value and not necessarily by calls exceeding SIP sessions (or SIP UA Call) assigned.
Warnings and alerts for congestion and before congestion has arisen
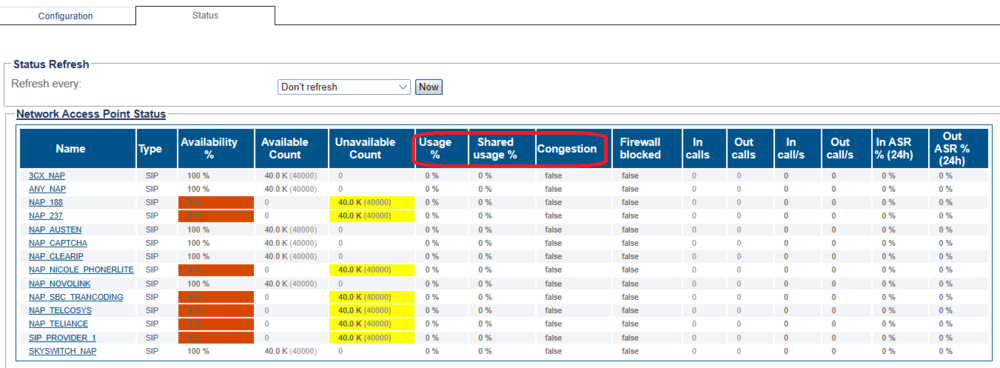
- There will be alerts/notices before resources have been used up, and warning in web portal when calls are dropped due to congestion, see NAPs status from Status in main web portal page,
- Congestion = true or false. This indicates if NAP is considered locally congested (too many call dropped due to local congestion in the last period).
- Usage percentage. SIP NAP will normally have usage percentage of 0, as SIP NAPs' resources are shared among SIP stack resource/SIP channels/SIP UA calls assigned.
- Shared usage percentage. This will indicate what percentage in relative to total SIP stack reources/SIP channels/SIP UA calls assigned. SIP NAP which is busy will higher value while SIP NAP which is more idle will have lower value.
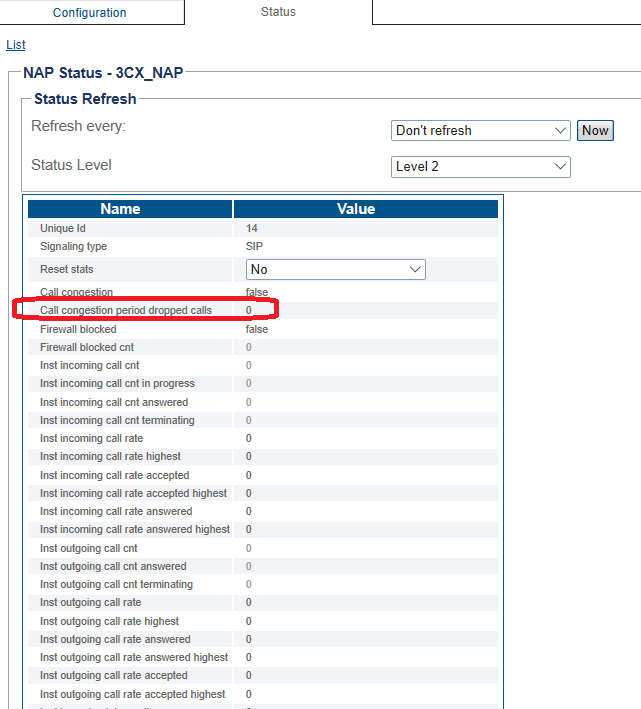
- There are also statistics in the NAP that indicate the number of calls dropped for each release cause (including for congestion) so one can know if the congestion situation had ever occurred. See Call congestion period dropped calls,
- There is a SNMP field for NAP's percentage usage, see tbNapAvailablePercent and tbNapUsagePercent in TB-MIB, and see SNMP. Normally, when SIP NAP is up, it is marked 100% availability, when congestion occurs, and SIP NAP will become no longer available and the availibilty percentage will become 0.
- There is no SNMP trap for this by default for this field, but one can be added by editing a configuration file if necessary. Or a shell script can be used to poll NAP's usage percentage and send whatever alert (email or other) when appropriate. See Tbstatus Application and Tbstatus monitoring.

